
See What Works, and What Costs You, Across Your Operations
Turn your time, HR and work data into clear dashboards you can act on. Intelligent Dashboards tell you what happened, why it matters, and what to do next. No data warehouse, no SQL, and no new security model required.
See What Stands Out in Your Data
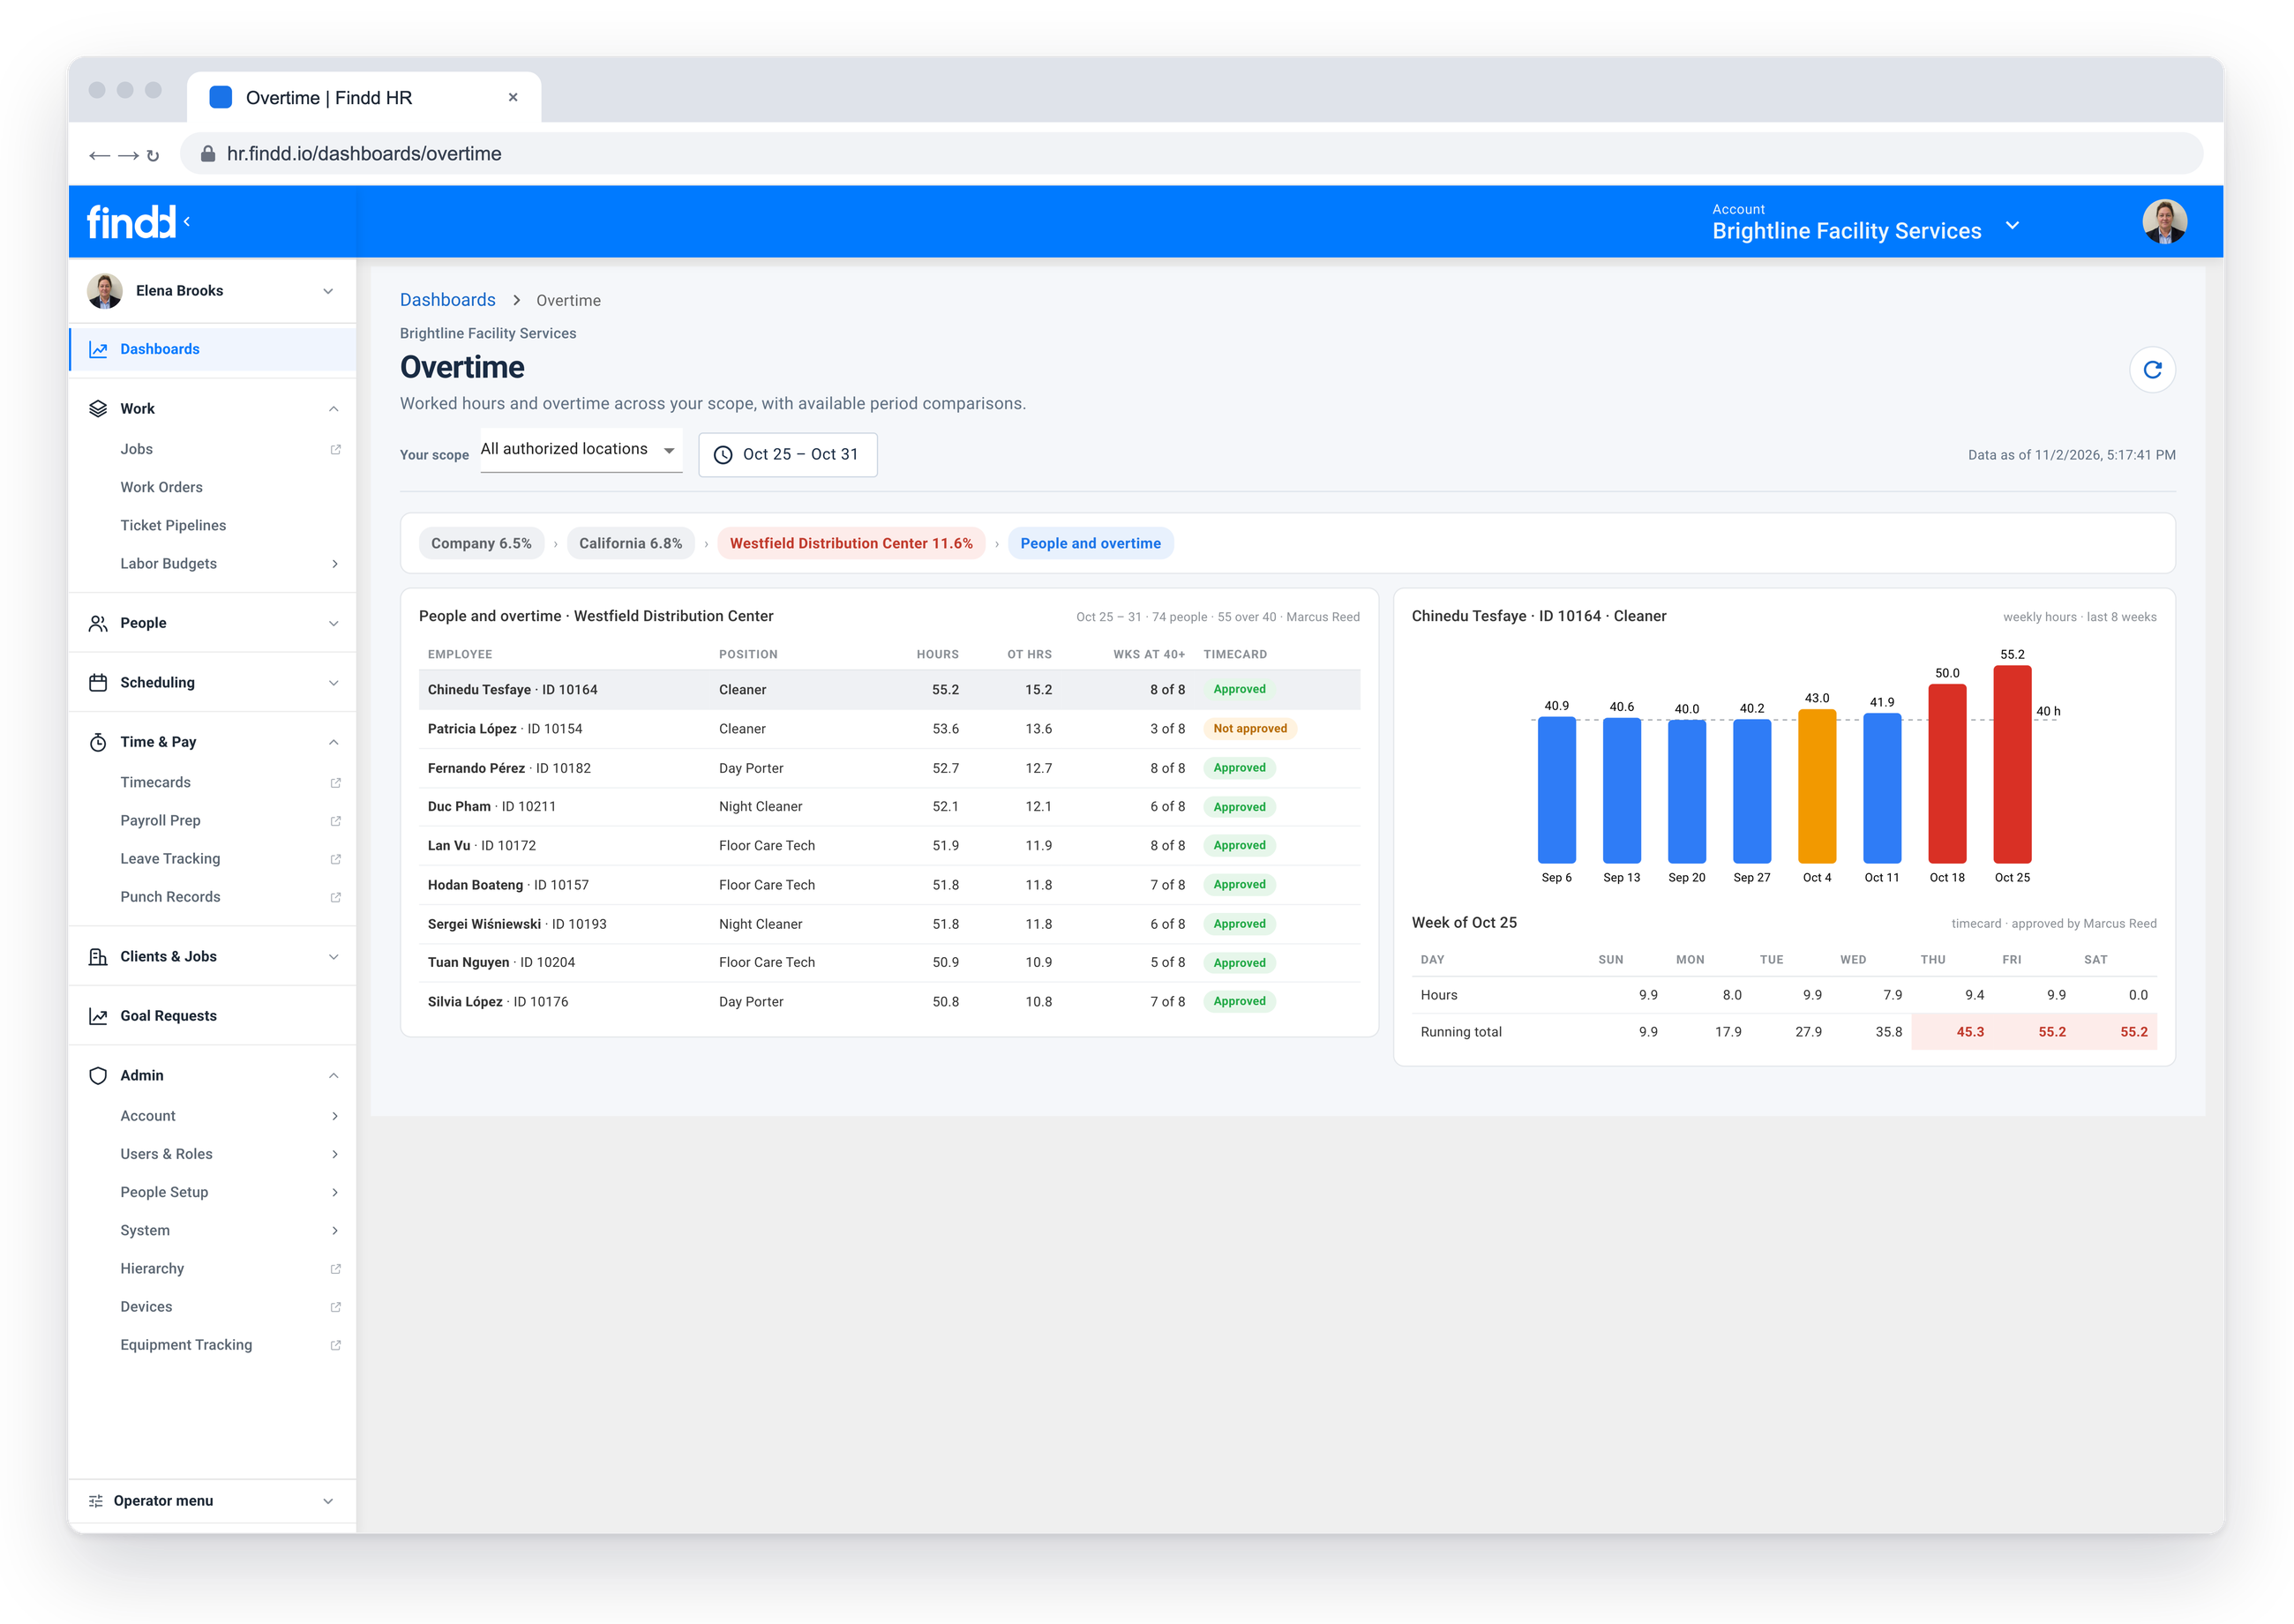
Intelligent summaries highlight what's important across your operational data, with the ability to explore from company to district to person-level data. DiDi creates plain language summaries, with suggested actions you can take based on what's working inside of your own business. You can drill down in any data to check the numbers behind any summary.
- Company 6.5%
- California 6.8%
- Westfield Distribution Center 11.6%
- People and overtime
People and overtime · Westfield Distribution CenterOct 25 – 31 · 74 people · 55 over 40 · Marcus Reed
| Employee | Position | OT hrs | Timecard |
|---|---|---|---|
| Chinedu Tesfaye · ID 10164 | Cleaner | 15.2 | Approved |
| Patricia López · ID 10154 | Cleaner | 13.6 | Not approved |
| Fernando Pérez · ID 10182 | Day Porter | 12.7 | Approved |
| Duc Pham · ID 10211 | Night Cleaner | 12.1 | Approved |
| Lan Vu · ID 10172 | Floor Care Tech | 11.9 | Approved |
| Hodan Boateng · ID 10157 | Floor Care Tech | 11.8 | Approved |
| Sergei Wiśniewski · ID 10193 | Night Cleaner | 11.8 | Approved |
| Tuan Nguyen · ID 10204 | Floor Care Tech | 10.9 | Approved |
| Silvia López · ID 10176 | Day Porter | 10.8 | Approved |
Chinedu Tesfaye · ID 10164 · Cleaner
weekly hours · last 8 weeks
Measure Against Your Own Performance
Your teams get measured against your own standards. Your best performers are highlighted and used as the benchmark your team should strive for. Ranking teams helps create friendly competition around performance and identify trends. You can easily spot areas for operational clean-up, like clusters of exceptions in specific jobs. Dashboards report what happened and don't judge anyone. Employee names appear only where a manager needs them.
6.5%
Company OT rate · $1.18M OT pay / yr
▼ 0.3 vs prior wk
11.6%
Westfield OT rate
Up from 4.1% in 8 weeks · Marcus Reed's crew
Over 40 last week · by supervisor
| Supervisor · crew | OT hrs |
|---|---|
| Marcus Reed · Westfield Distribution Center · 76 people | 394 |
| Chinedu Tesfaye · 55.2 hrs · 8 of 8 wks | 15.2 |
| Fernando Pérez · 52.7 hrs · 8 of 8 wks | 12.7 |
| Duc Pham · 52.1 hrs · 6 of 8 wks | 12.1 |
| Kim Patel · Harbor Point Tower · 74 people | 146 |
| Minh Hoang · 50.0 hrs · 5 of 8 wks | 10.0 |
| Andre Thompson · Riverside City Hall · 43 people | 119 |
| Silvia Rodríguez · 48.1 hrs · 5 of 8 wks | 8.1 |
| Rosa Delgado · Lakeside Medical Center · 68 people | 86 |
| Mei Chen · Northgate A, B, C · 23 people | 36 |
Westfield OT rate
11.6%
Up from 4.1% in 8 weeks · Marcus Reed's crew
Solve Problems That Save Money
Intelligent dashboards connect your operations to real dollars: overtime, hand-edited time, quality of service, employee retention, and more. You can see how much margin your team can win back with operational focus, with Intelligent Dashboards that help you solve problems before they hit payroll.
Overtime by group12 of 13 authorized hierarchy groups shown · 1 known zero-work groups hidden.
| Hierarchy group and descendants | OT hours | OT share | Period change |
|---|---|---|---|
| WestTop-level group | 625.45 h | 6.78% | -0.21 ppPercentage points |
| Valley DistrictVisible path: West | 393.74 h | 11.59% | -0.01 ppPercentage points |
| Westfield Distribution CenterVisible path: West › Valley District | 393.74 h | 11.59% | -0.01 ppPercentage points |
| Bay DistrictVisible path: West | 231.71 h | 3.98% | -0.29 ppPercentage points |
| Harbor Point TowerVisible path: West › Bay District | 145.54 h | 4.73% | -0.16 ppPercentage points |
| CentralTop-level group | 118.53 h | 6.54% | +0.45 ppPercentage points |
| Metro DistrictVisible path: Central | 118.53 h | 6.54% | +0.45 ppPercentage points |
OT premium (0.5×) per year
$0.39M
priced on 100% of OT hours · Westfield is half
Every Dashboard Includes Actions
The data tells you what's happening, and DiDi suggests what you can do about it. You can choose which actions to take, like sending district managers an overtime list every week, and then monitor how those actions change your metrics over time. With one click, DiDi sets up the workflow and sends out the texts.
If you can see the data in Findd, you can turn insights into actions.

DiDiOvertime · Oct 25 – 31
Send each site supervisor their overtime list every Monday morning.
Here is what I will set up:
- What: last week's people over 40 hours at their own site, sorted by weeks over 40
- When: every Monday at 7:00 AM, site time
- How: email, with a link back to this dashboard
Recipients
- Marcus Reed · Westfield Distribution Center
- Kim Patel · Harbor Point Tower
- Andre Thompson · Riverside City Hall
- Rosa Delgado · Lakeside Medical Center
- Mei Chen · Northgate A, B, C
A copy of all five goes to you.
Turn it on
Done. The first one goes out Monday, Nov 9 at 7:00 AM. Ask me any time to pause or change it.
Intelligence Built for Frontline Operations
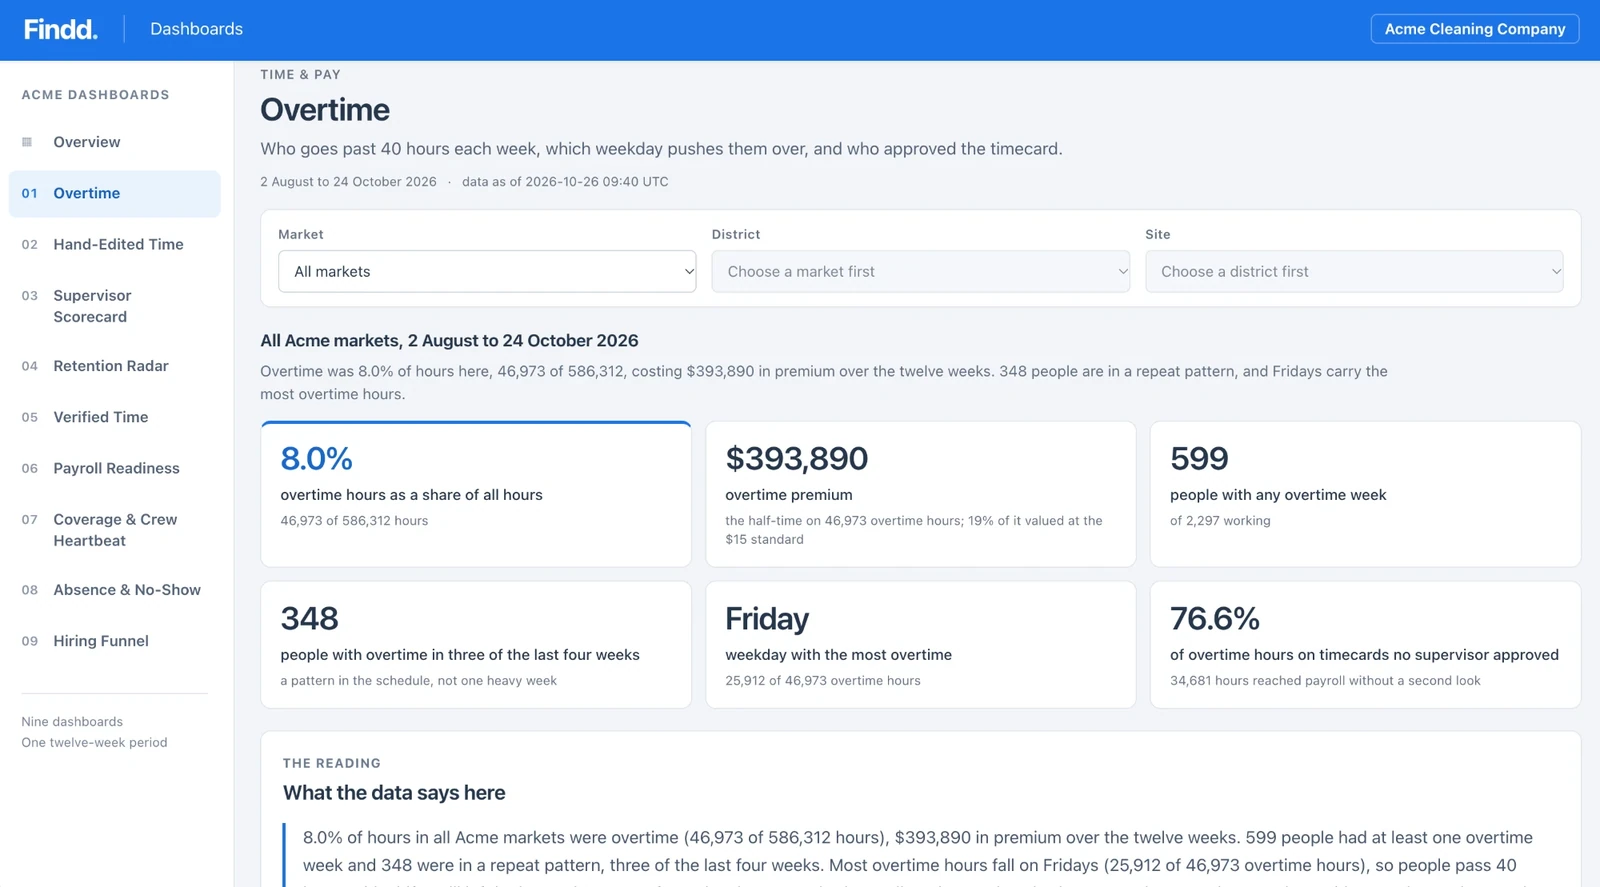
who goes past 40 hours, which weekday pushes them over, and who approved the timecard
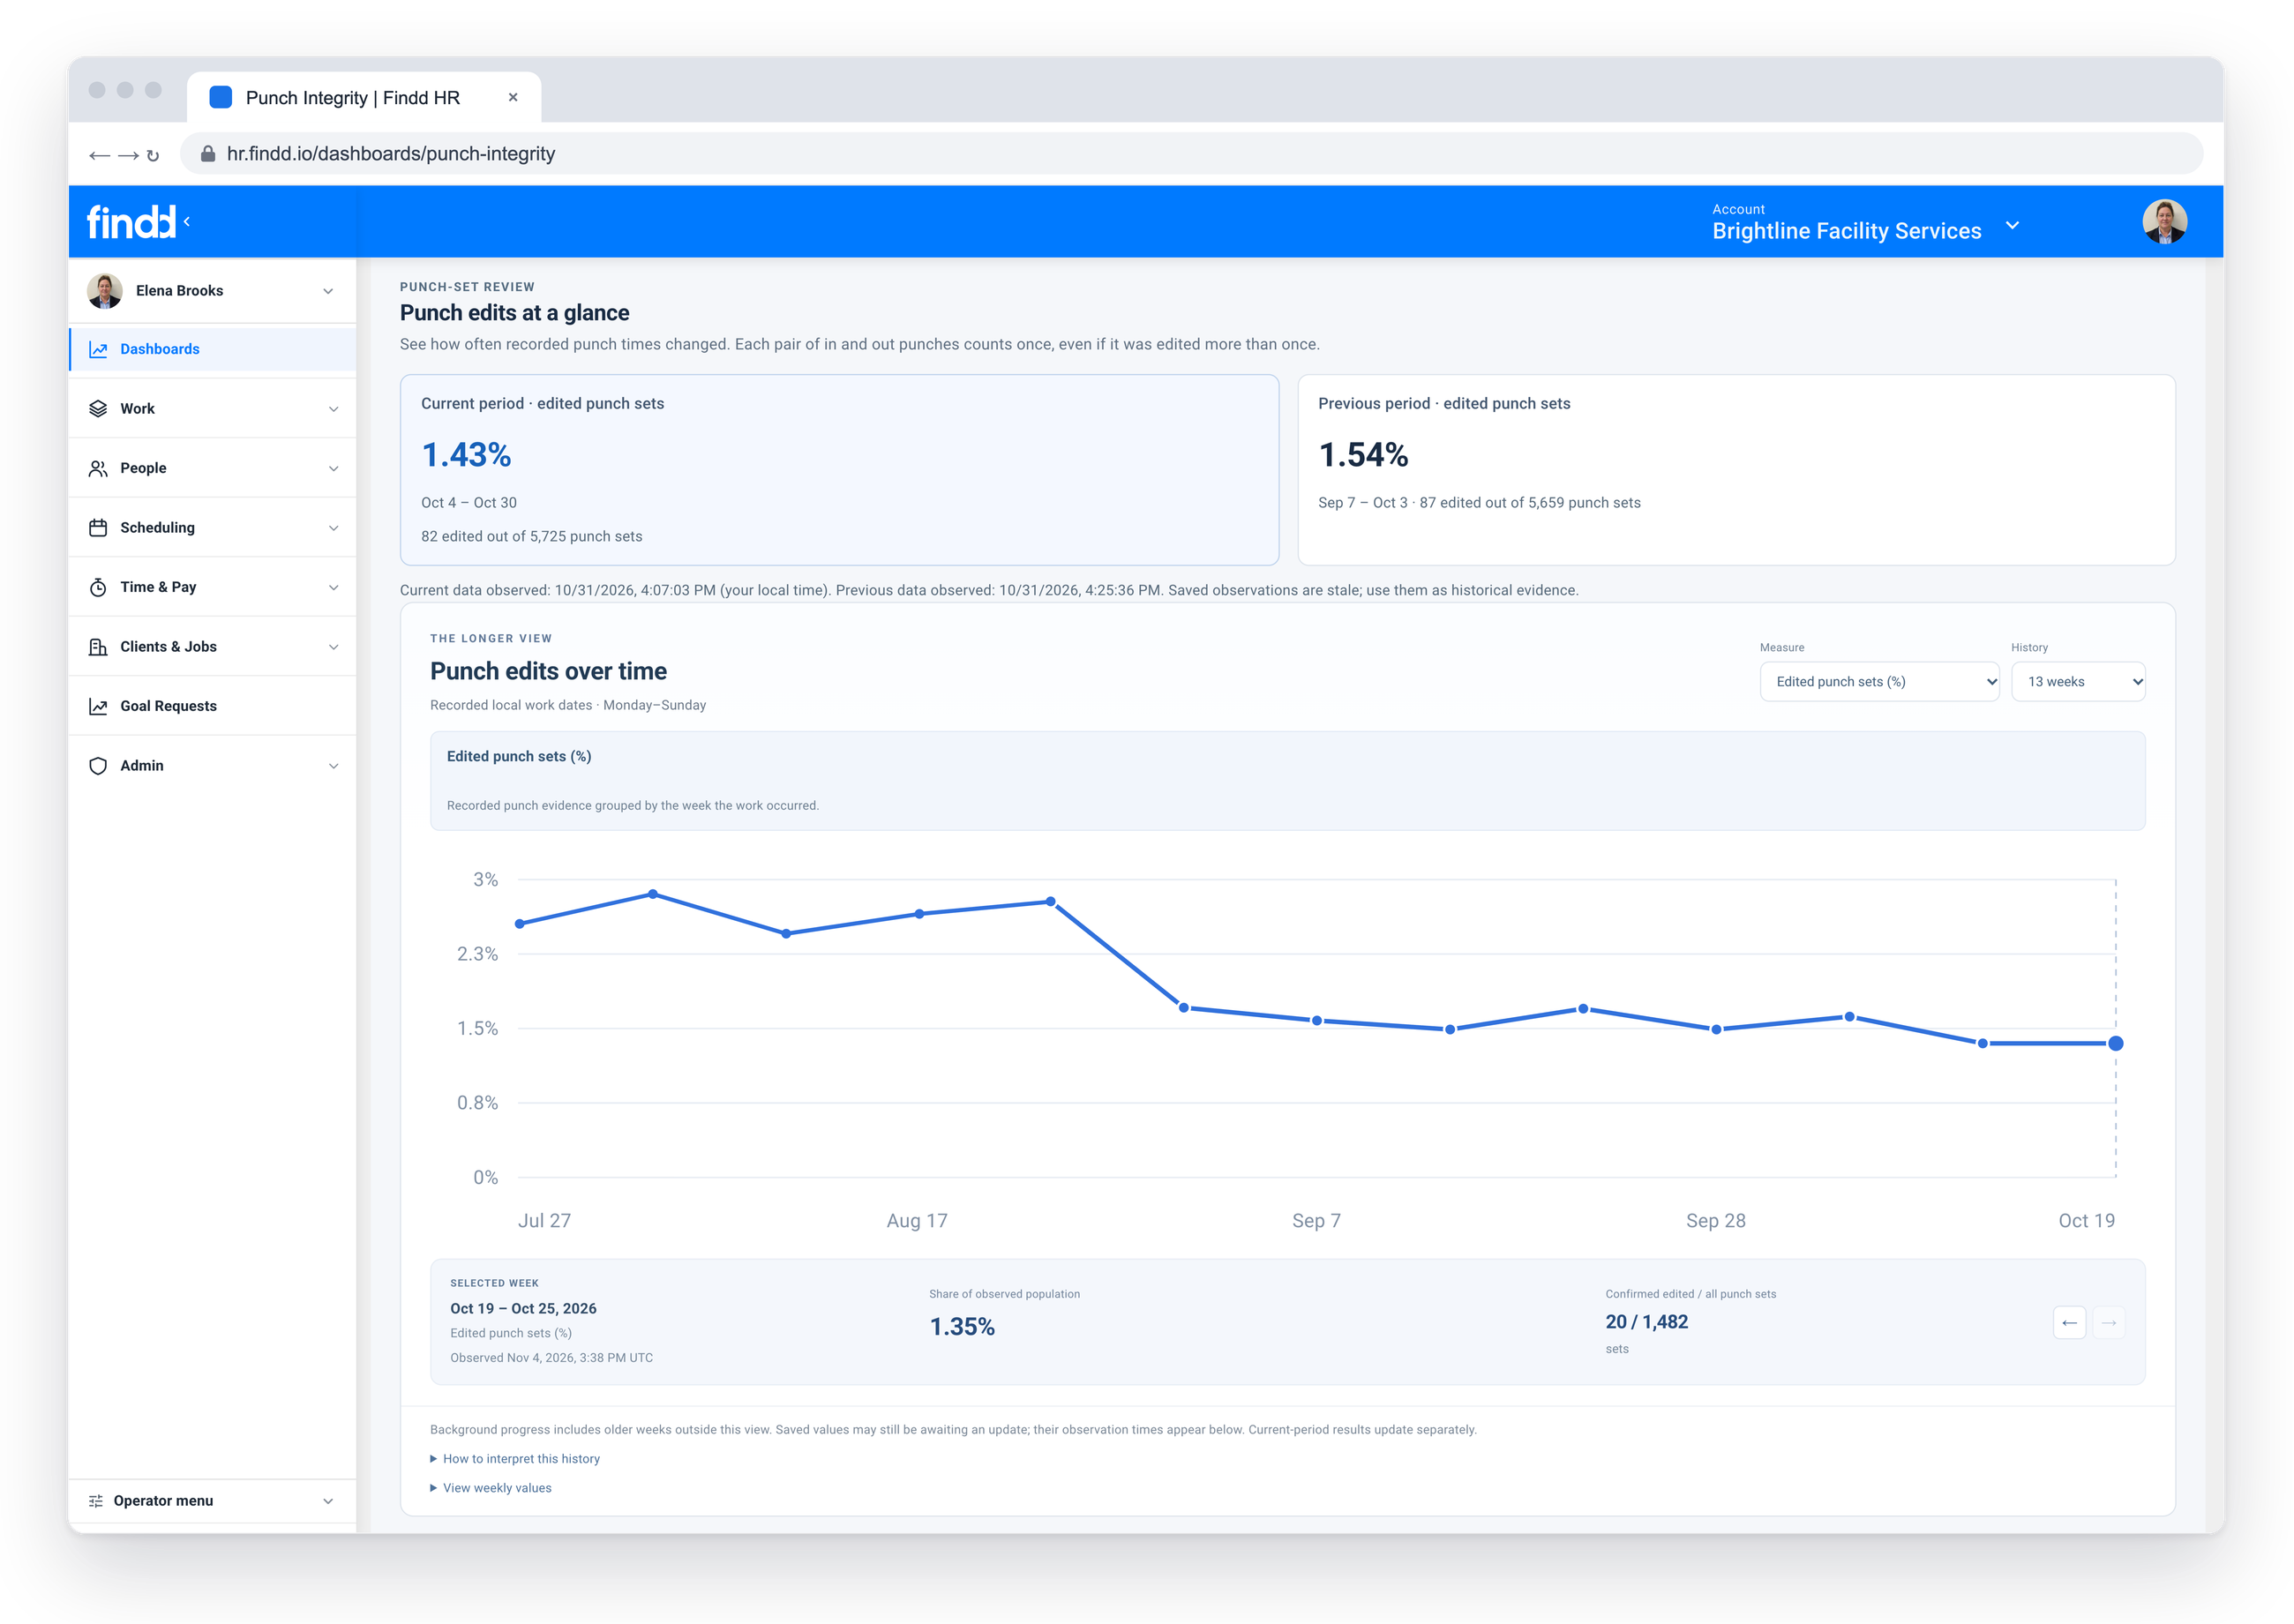
which paid hours were typed in or moved by hand instead of punched, and why
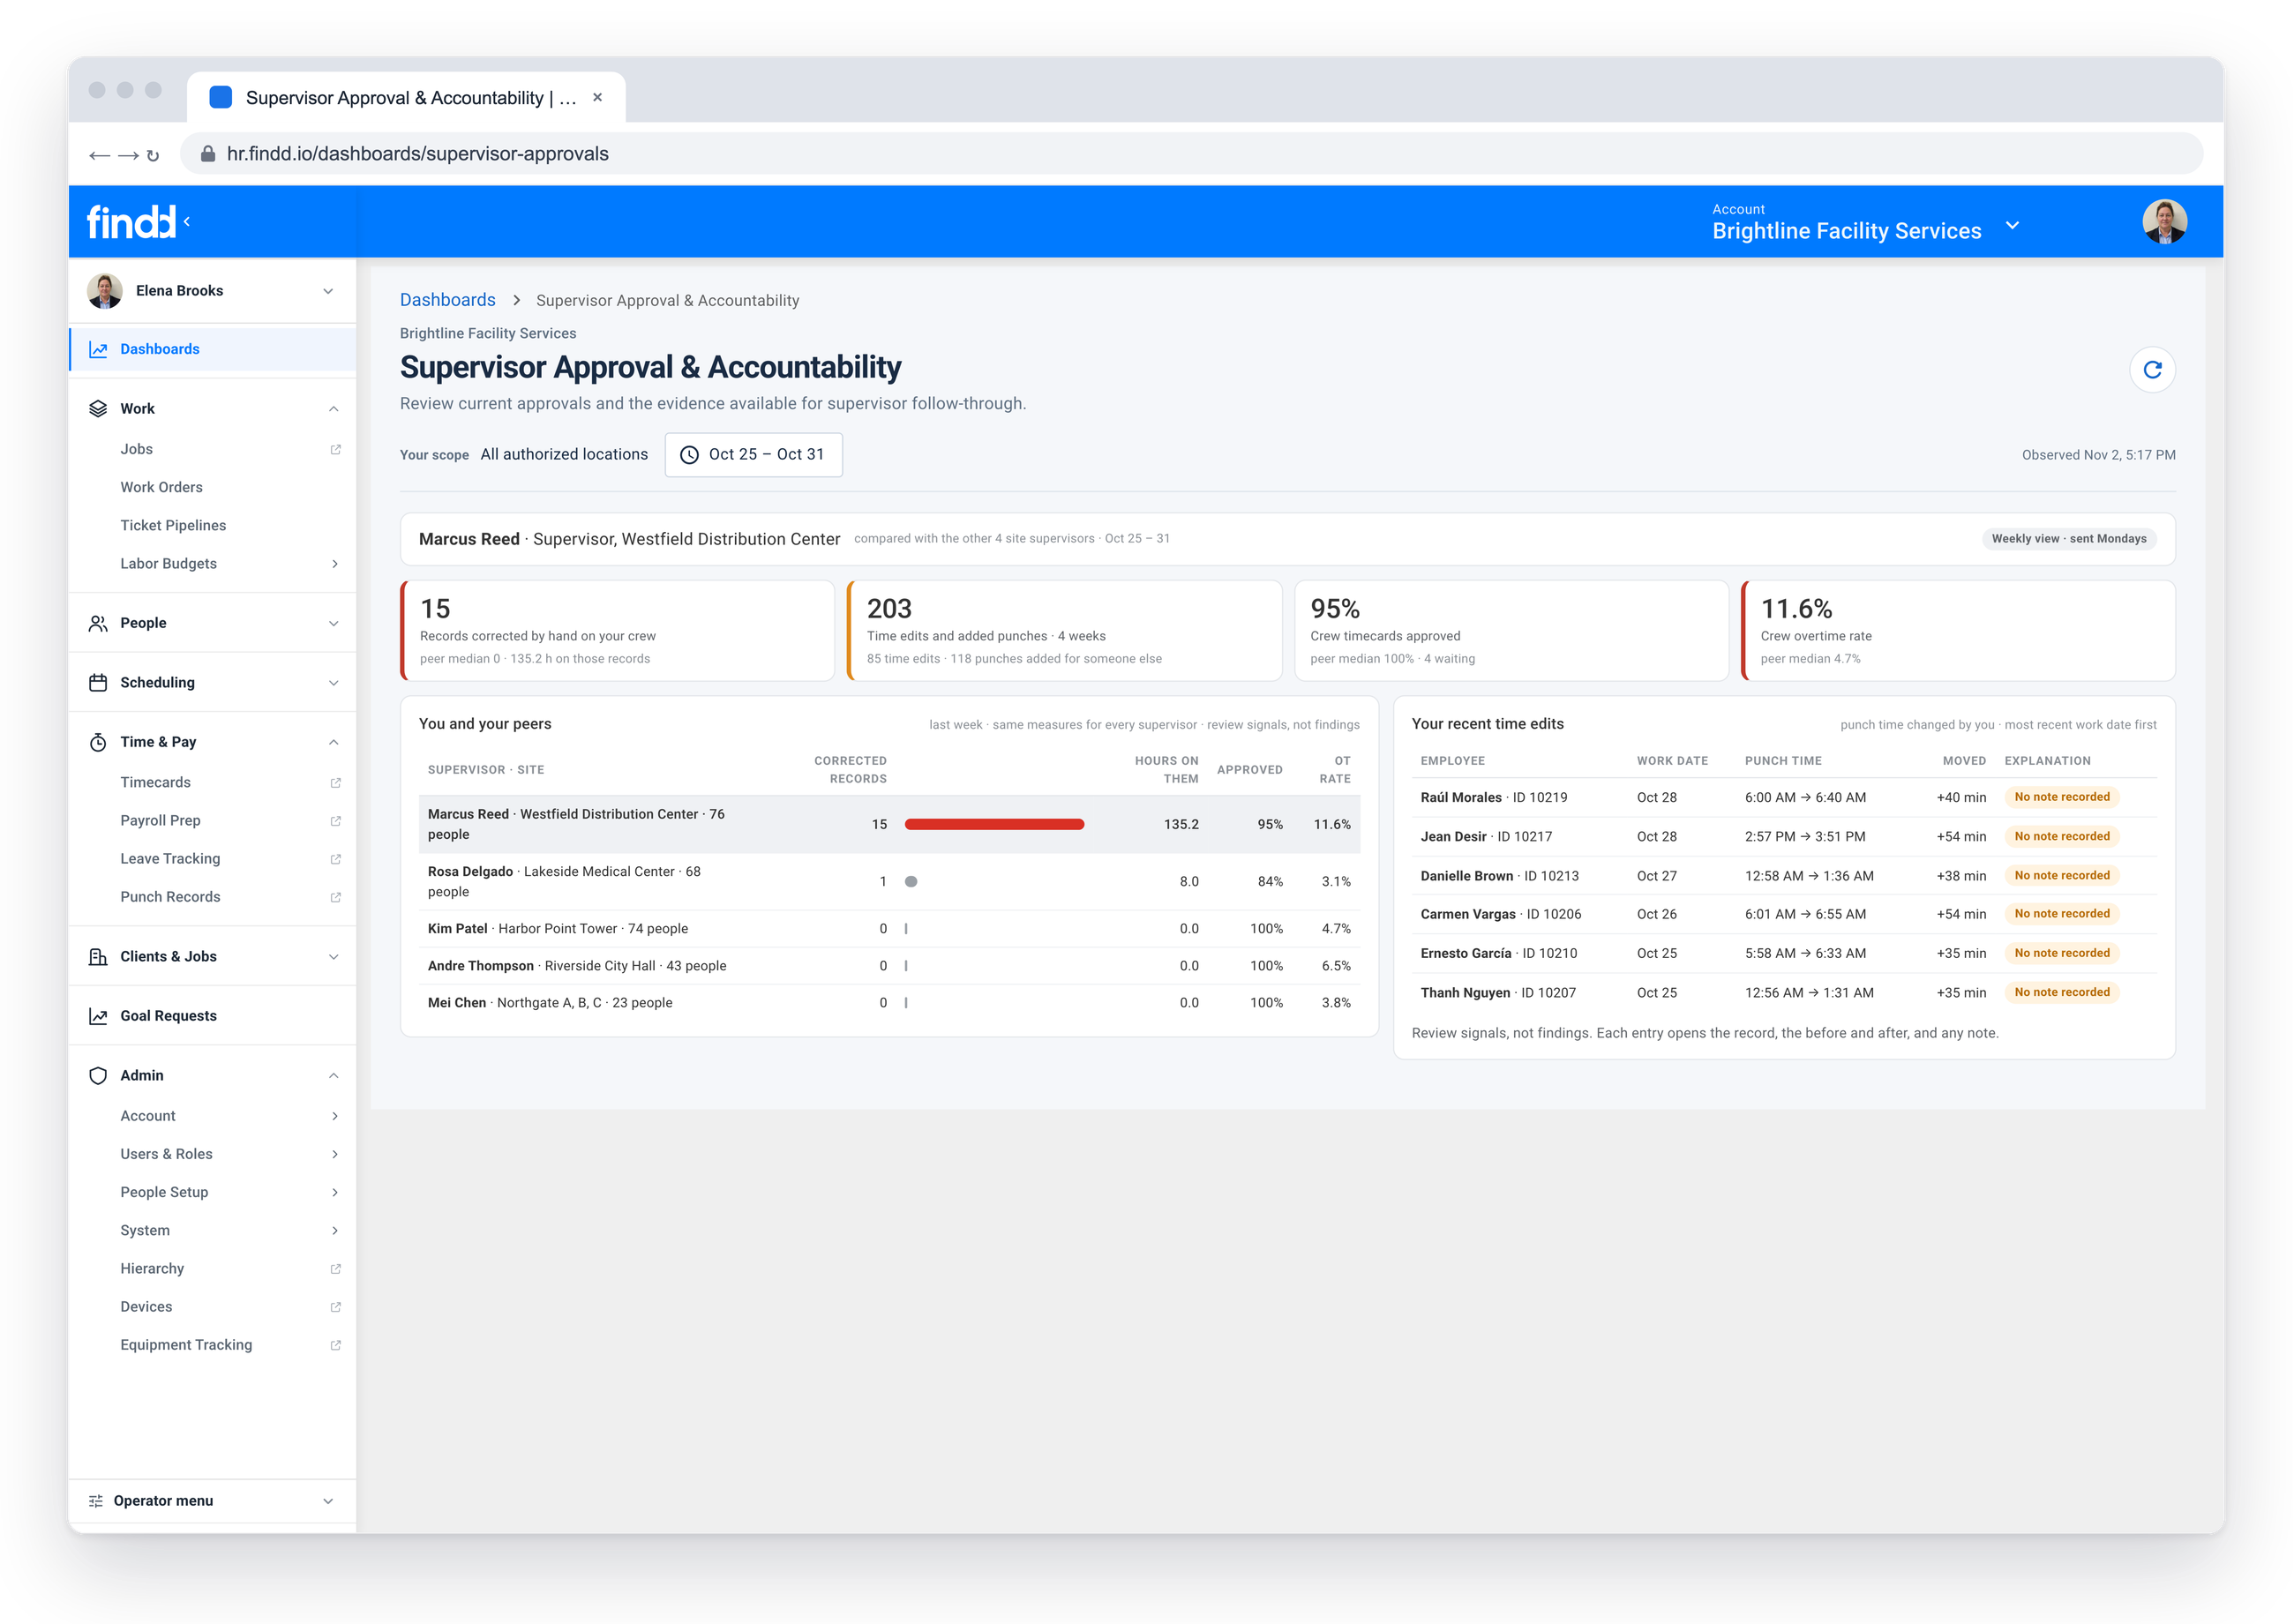
five numbers for each supervisor, compared with their peers, with the trend over time
who's leaving, by site and manager. It counts people who quietly stopped punching as well as formal terminations
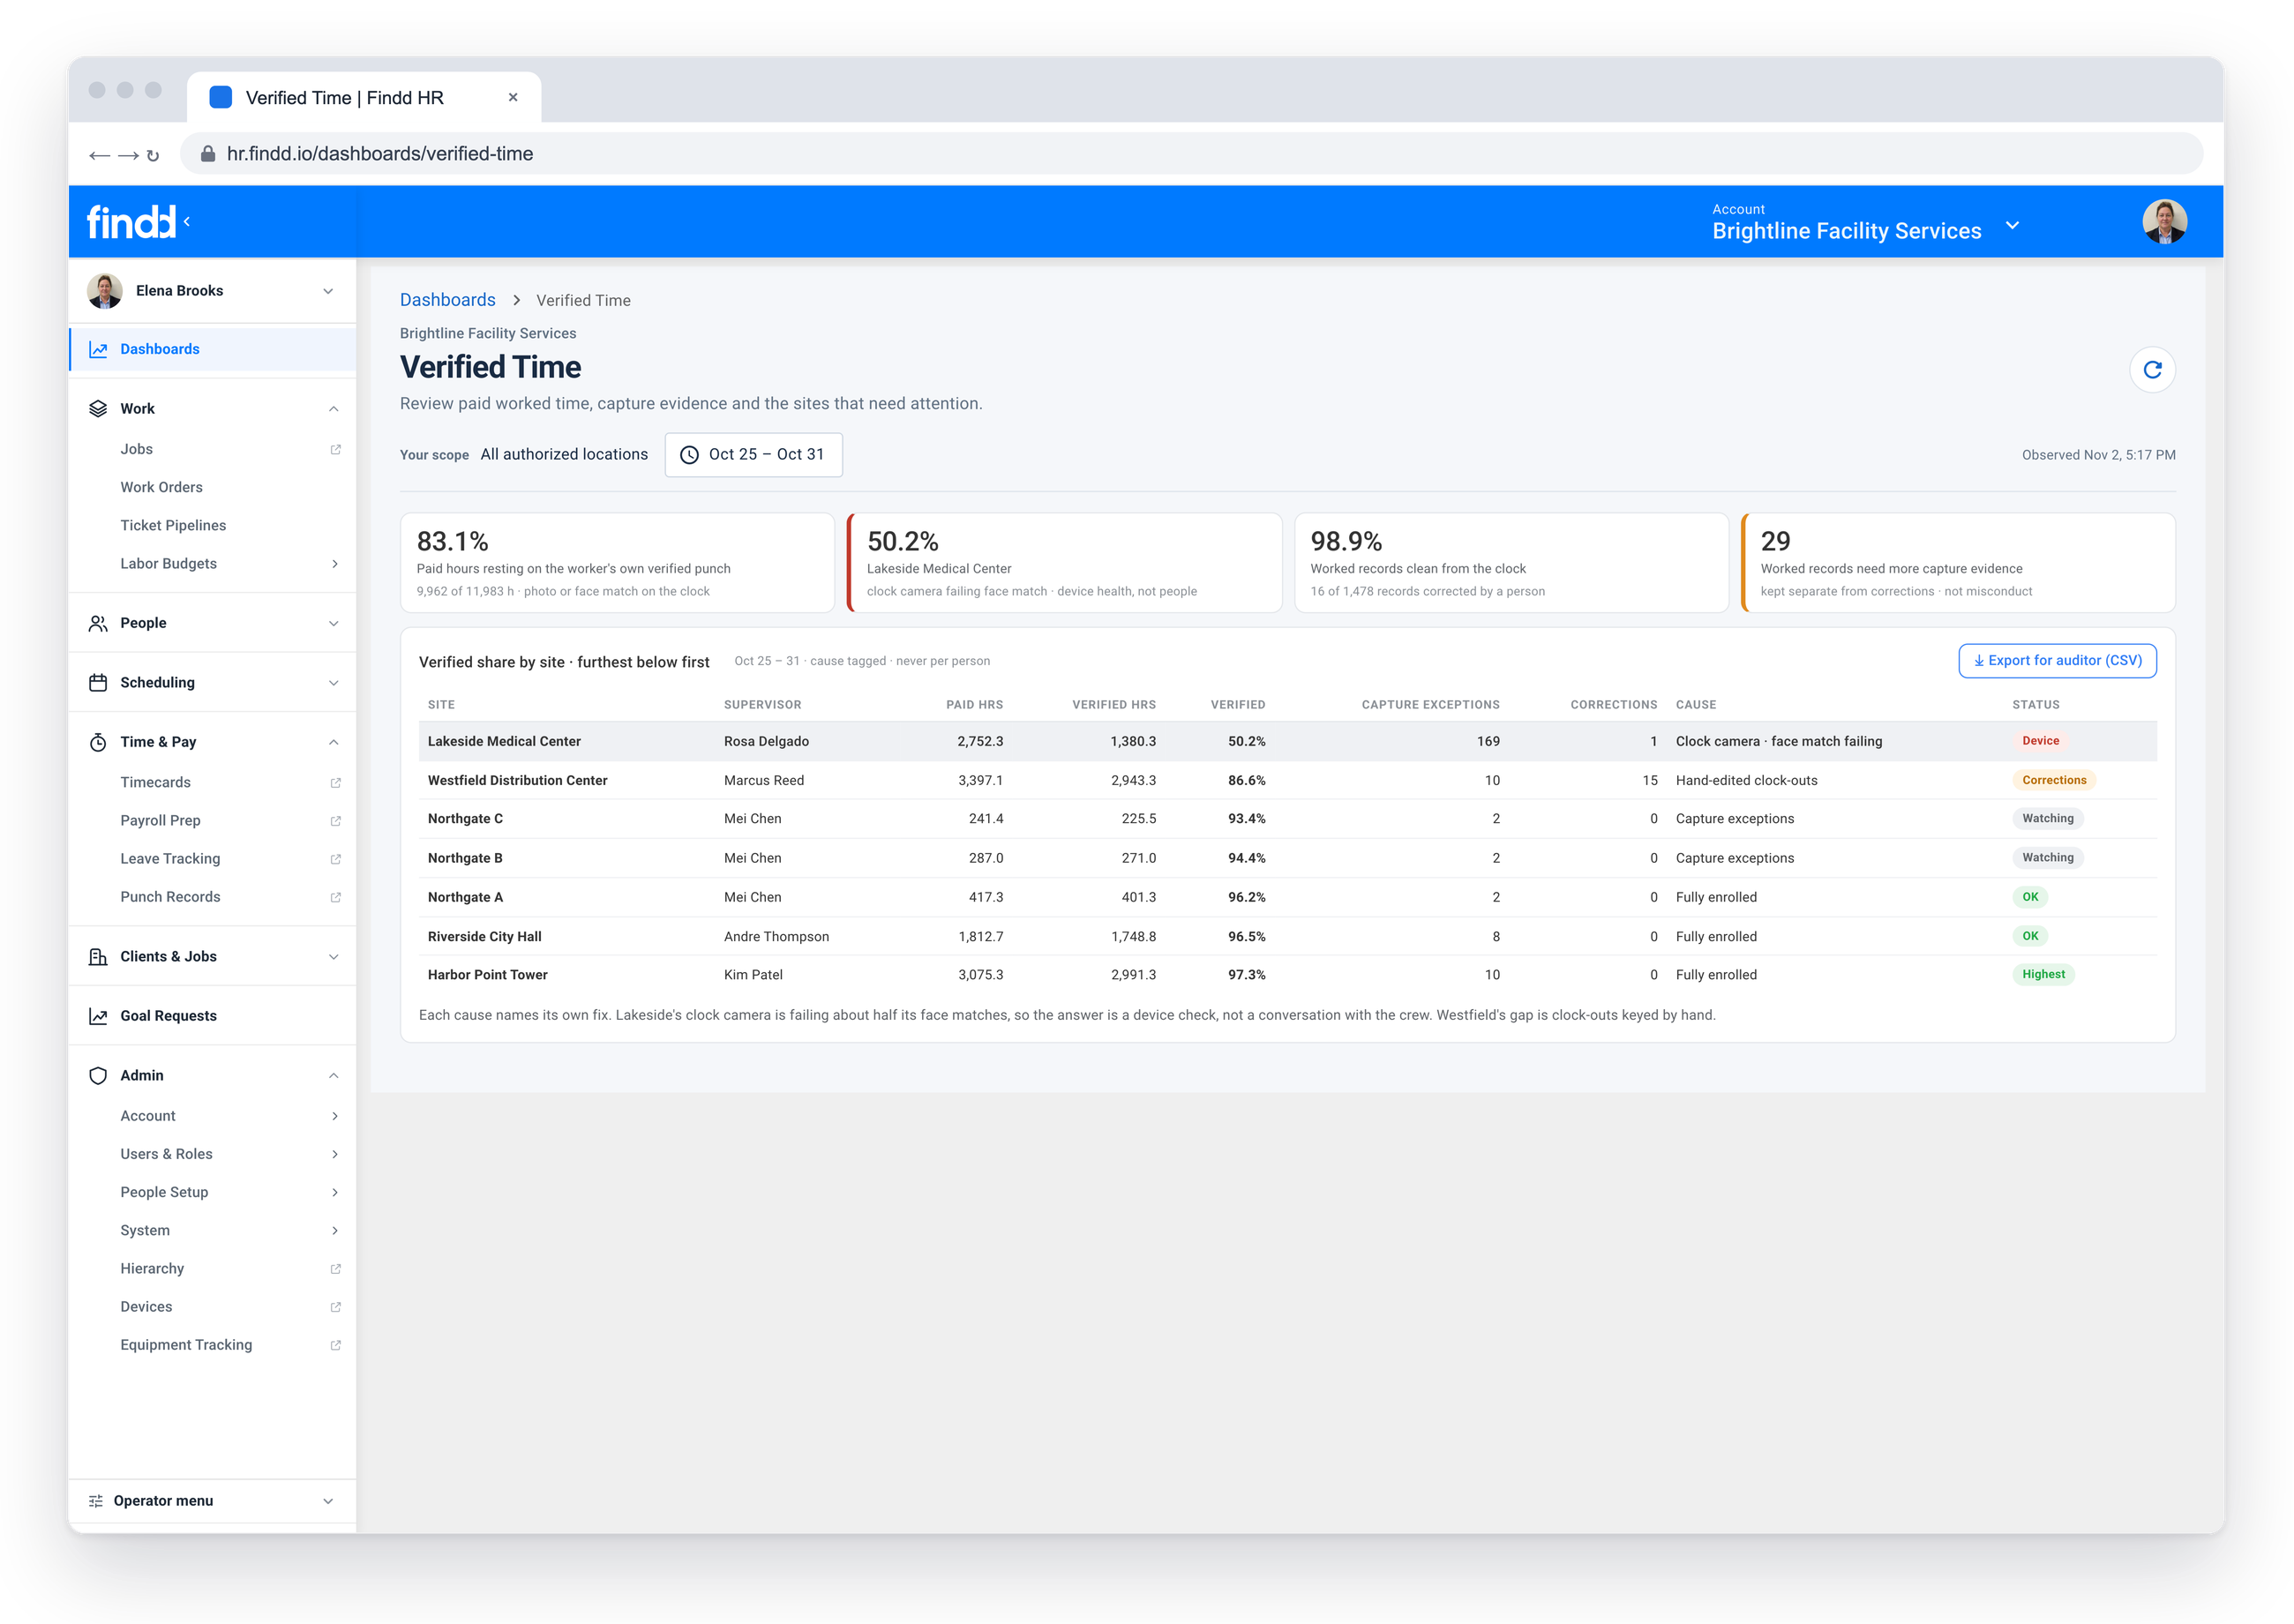
how much of payroll comes from punches where the clock confirmed who was there
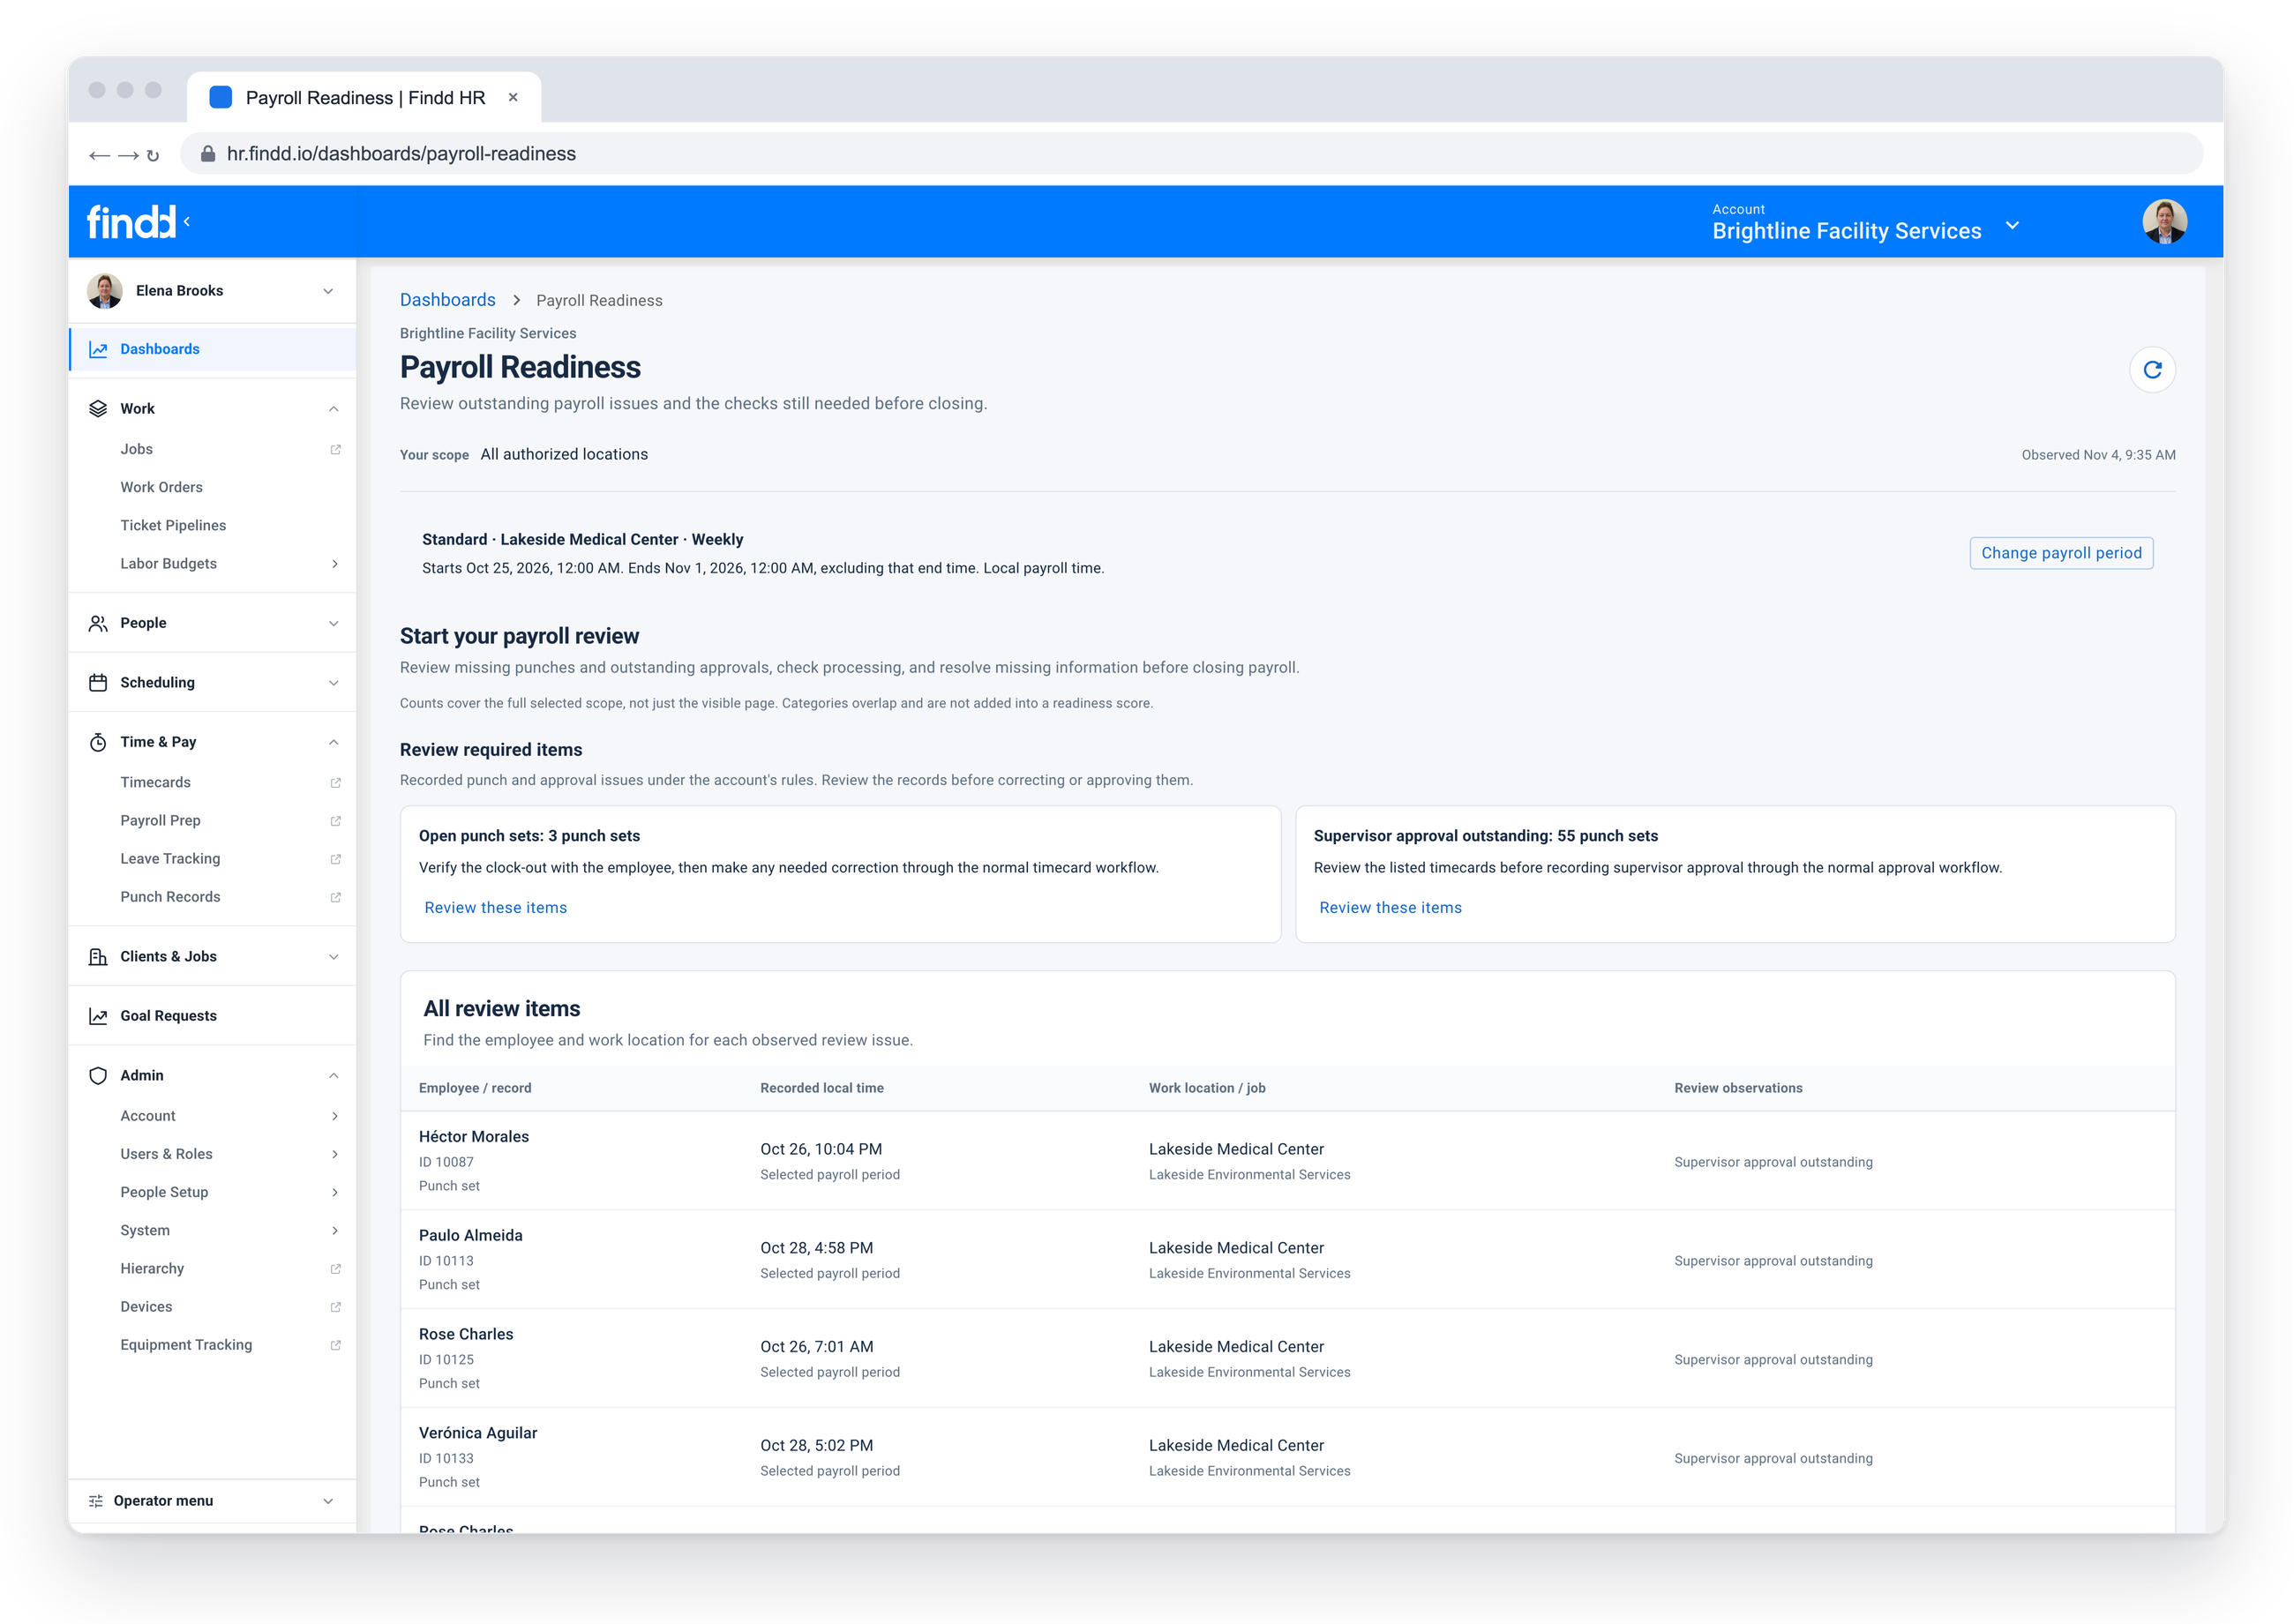
what would have broken payroll this week, ranked by dollars, and who could have fixed it that day
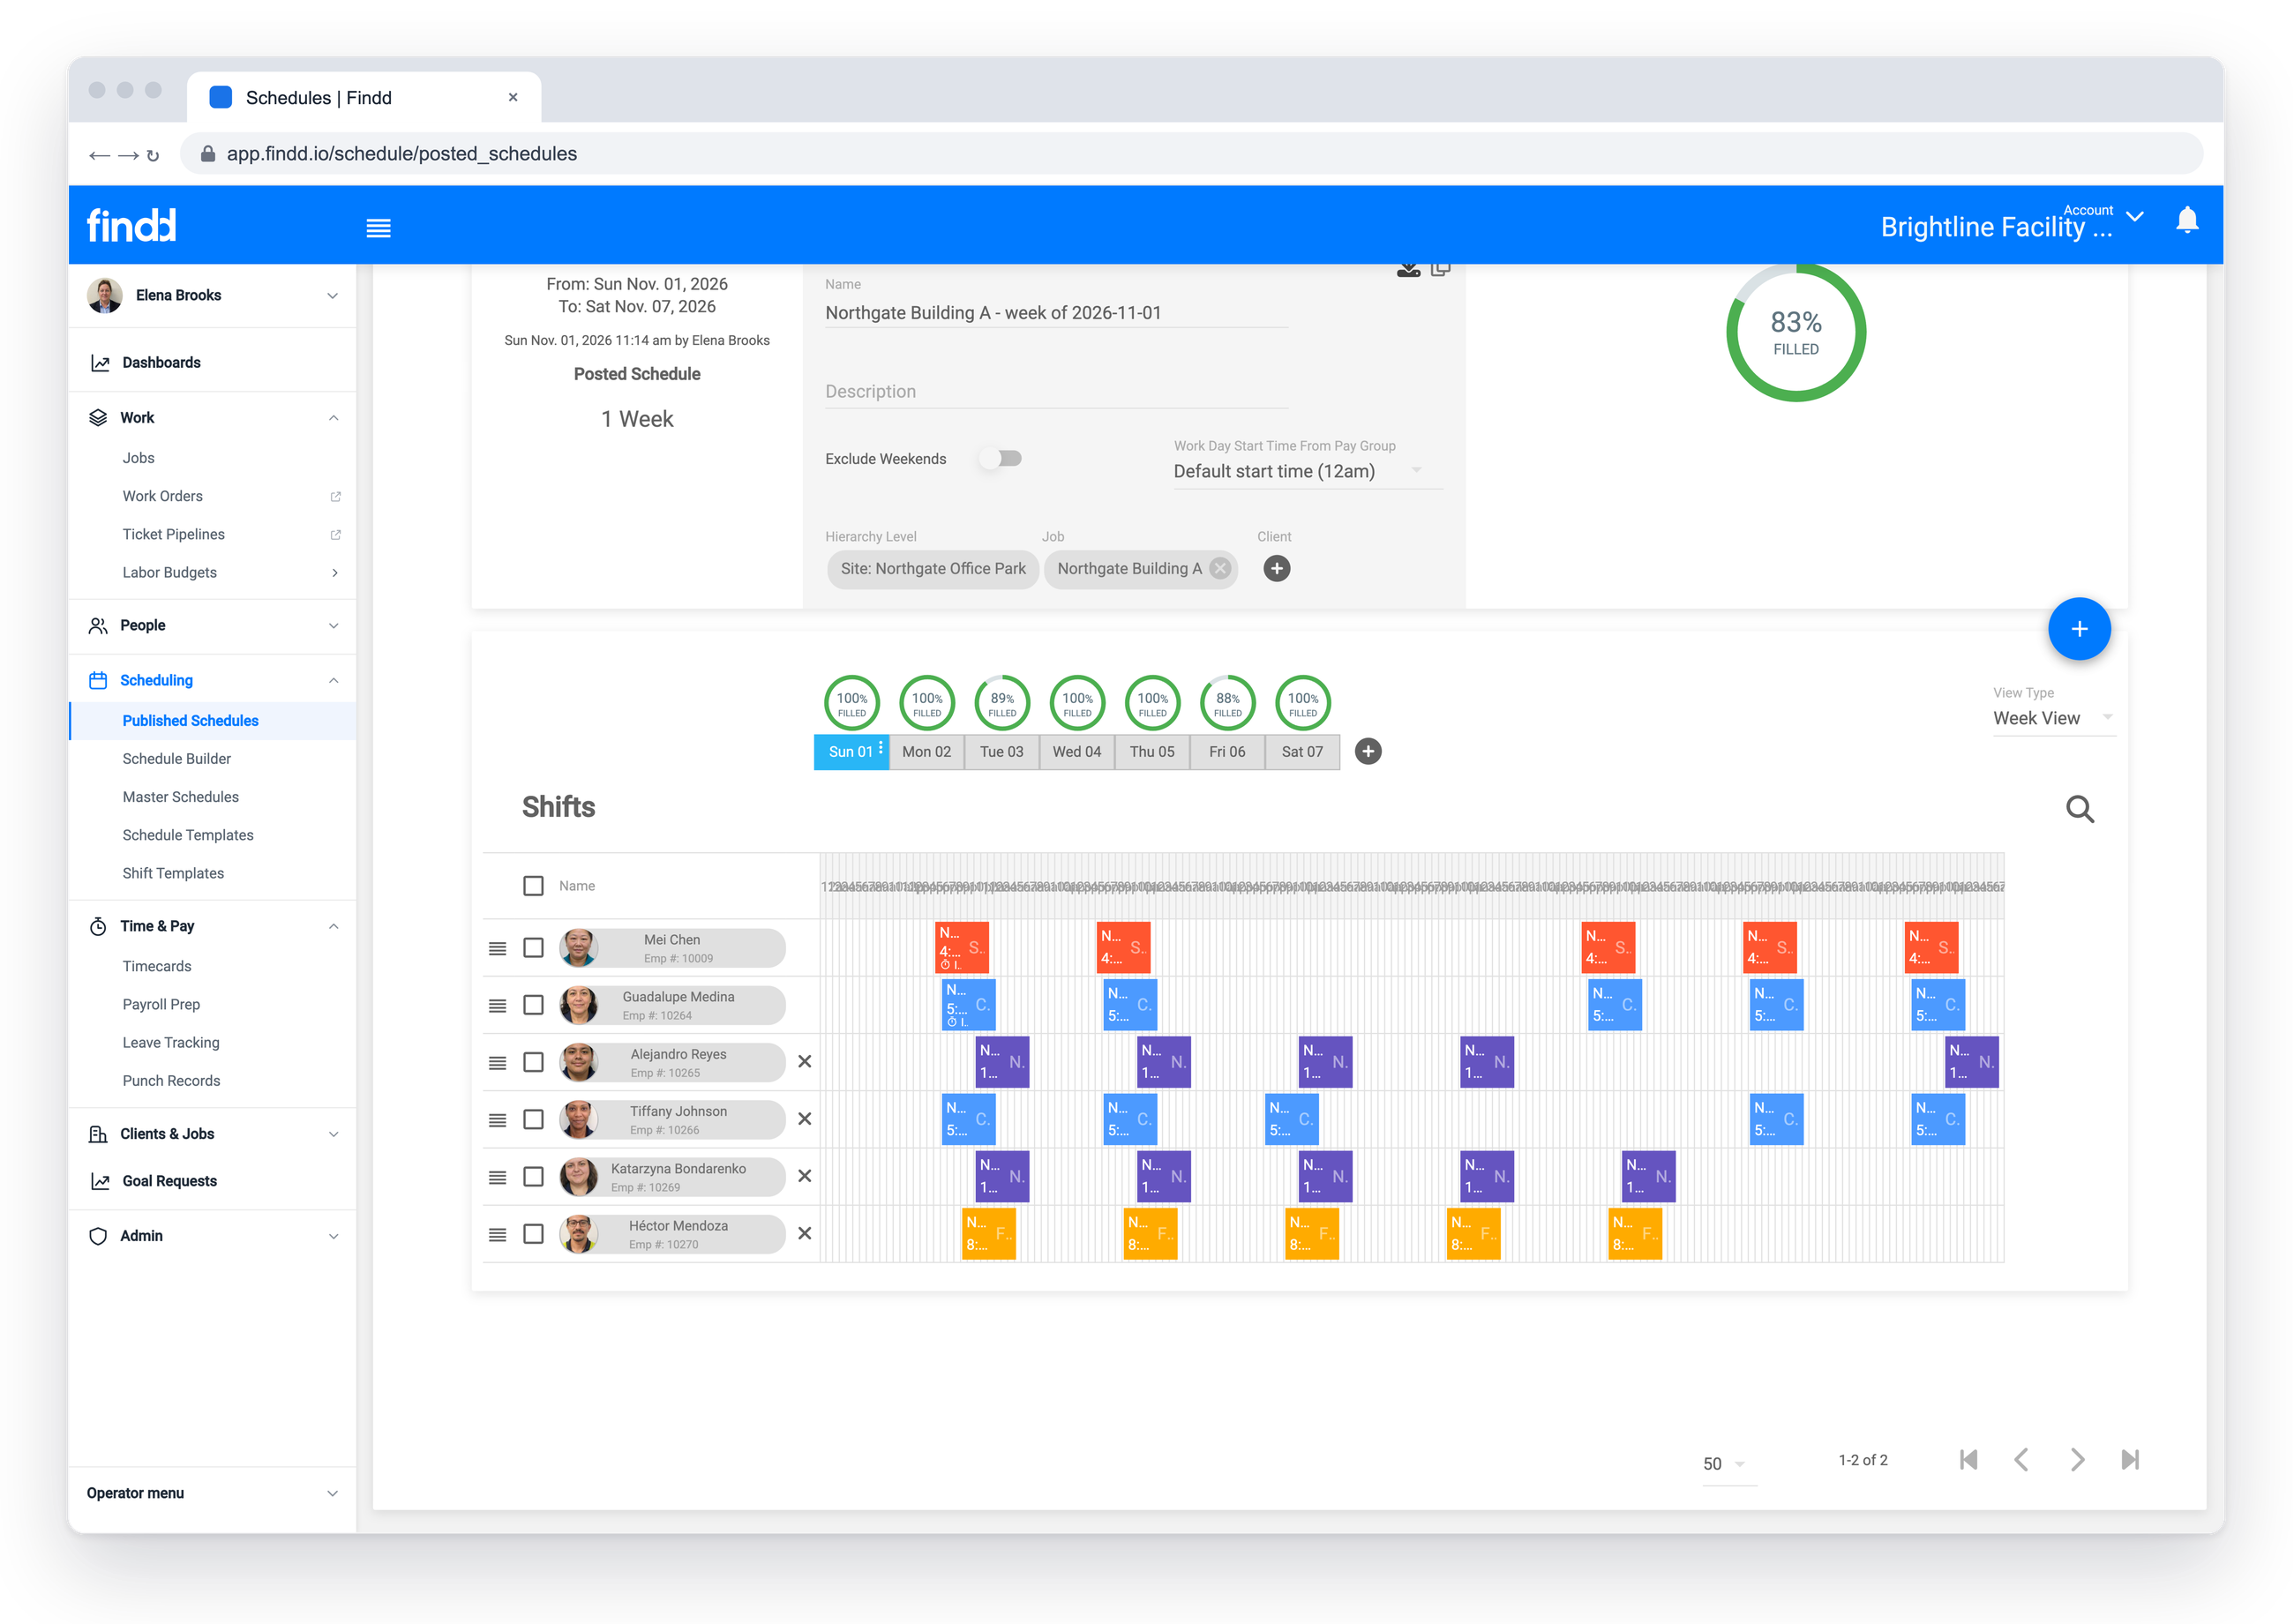
which sites ran short and which crews are turning over

who didn't show, whether it's a pattern, and who covered
from application to first punch, week by week, so you can see who actually started work
Connect Budgets to Actuals
Bring your budgets into Findd and identify variances by account, by site, by supervisor. Overtime is shown against your budgets, so a busy site earning a 20% margin won't get flagged like a site that's losing money. Budgets can use production rates, square footage and seasonal changes, so each contract is measured against its own plan.
Budget OverviewAccount · 09/27/2026 – 10/24/2026 · whole weeks: 09/20/2026 – 10/24/2026 · 7 of 7 budgets
| Job | Oct 12 | Oct 19 | Total |
|---|---|---|---|
| Harbor Point Tower Janitorial10410 · Account › West › Bay District › Harbor Point Tower | 3,047.83/ 2,751.00 | 3,085.32/ 2,751.00 | 15,435.69/ 13,755.00 |
| Lakeside Environmental Services10425 · Account › West › Bay District › Lakeside Medical Center | 2,771.97/ 2,745.75 | 2,733.33/ 2,745.75 | 13,897.14/ 13,728.75 |
| Northgate Building B10441 · Account › East › Northeast District › Northgate Office Park | 293.11/ 283.50 | 285.56/ 283.50 | 1,412.42/ 1,417.50 |
| Riverside City Hall Custodial10460 · Account › Central › Metro District › Riverside City Hall | 1,883.81/ 1,701.00 | 1,844.66/ 1,701.00 | 9,148.20/ 8,505.00 |
| Westfield Warehouse Cleaning10470 · Account › West › Valley District › Westfield Distribution Center | 3,374.44/ 3,410.75 | 3,407.30/ 3,410.75 | 16,688.41/ 17,053.75 |
1–7 of 7
By category
59,848.95 hrs
actual 59,848.95 / budget 57,645.00
The Right View for Every Role
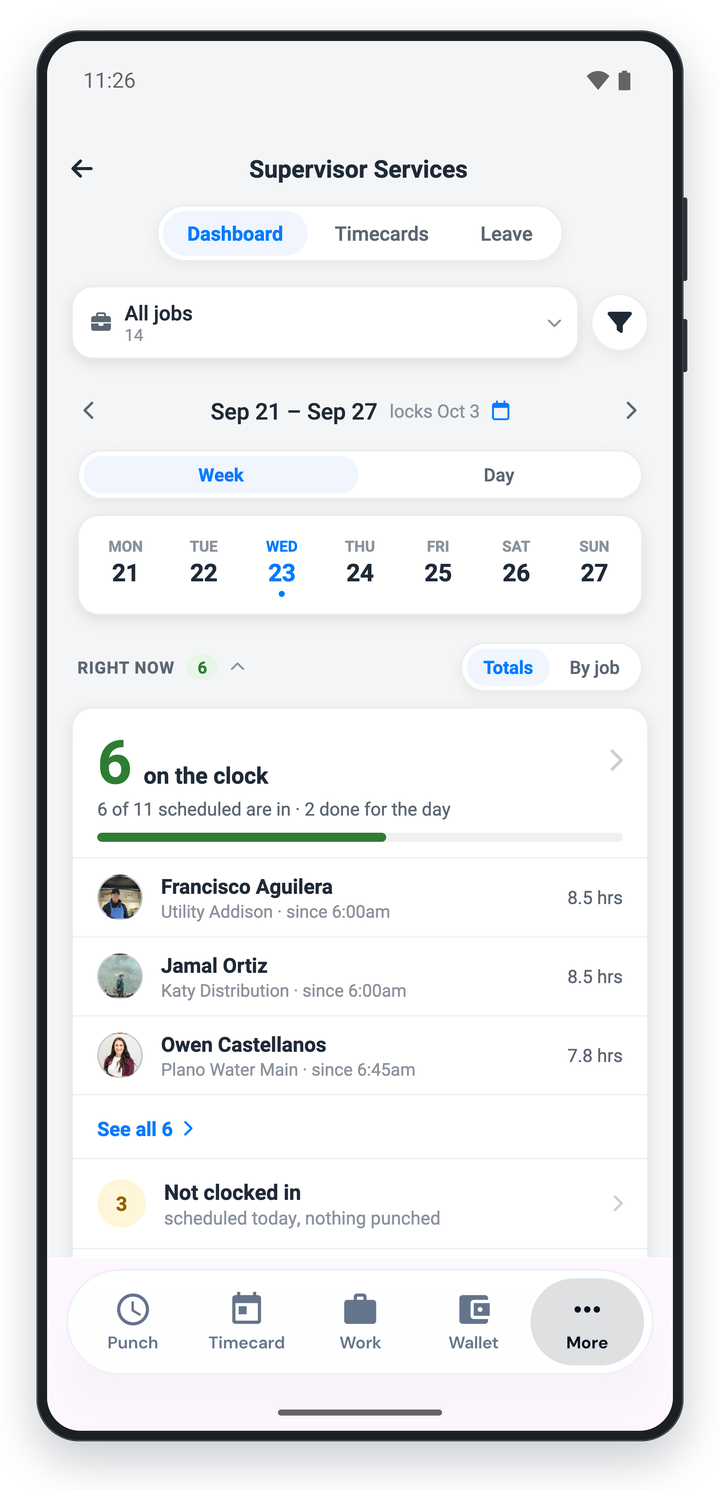
Each role gets a dashboard focused on what they care about. Executives get three or four KPIs. Operators get their regions. Site and area managers see hours, overtime, and open punches for their own buildings on their phone, the same day, so they don't wait on a report from the office. Everyone sees only what they're responsible for with smart filtering and permission management built-in.
Accessible for Everyone
Clear, plain language definitions are added to every page so that everyone can make use of the system, whether or not they've ever used a dashboard. DiDi is right there for your team to ask questions, get clarification, explain the data, and turn insights into action.
DiDiOvertime · Oct 25 – 31
What does overtime share mean?
It is the part of worked hours that was paid as overtime: recorded overtime hours ÷ worked hours.
Last week Brightline worked 11,983 hours, and 780 of them were overtime, so the share was 6.5%.
- Double overtime is counted separately.
- Paid leave and holidays are not worked hours, so they are left out.
- A gap in the chart means that week has no usable totals, not zero overtime.
Exportable Data
You can export data you need for analysis, either through CSV, direct integration, or API into your own data lake.
Account Settings
Custom Reports/Scripts
- Payroll Time Export - Hours by Work State
Localization
Hierarchy
Accrual Adjustment Rules
Integration
Import CSV file
Payroll Export
Scheduled Jobs
Payroll Time Export - Hours by Work State.xls
The Findd Operating System
When you use Intelligent Dashboards with HR, WorkOps, TLM and DiDi, your dashboards see the whole picture, from the first application through the last punch to payroll. Intelligent Dashboards show you where to look, and DiDi helps you act. From schedules, to approvals, to leave tracking, when you use the full Findd system you can see where your margin lives.
Learn more about Frontline Operating System ›